Moez AliEasily deploy machine learning models from the comfort of your NotebookStreamline your Machine Learning model deployment with Modelbit.com. Seamlessly move from Jupyter notebooks to production-ready REST APIs…9 min read·Sep 8, 2023--2--2
Moez AliRevolutionizing Data Privacy: Generate Synthetic Databases with Gretel RelationalGenerate Synthetic Databases with Gretel Relational — The Future of Data Privacy10 min read·May 10, 2023----
Moez AliThe Ultimate Guide to Command Line Arguments in Python ScriptsA Comprehensive beginner friendly tutorial on using command-line arguments in Python·7 min read·Apr 18, 2023----
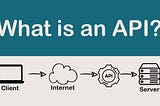
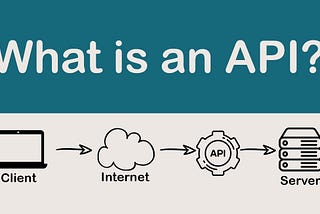
Moez AliDemystifying APIs: A Comprehensive Guide to Application Programming Interfaces in PythonA Beginner’s Guide to Python APIs: Understanding Application Programming Interfaces·10 min read·Apr 10, 2023--1--1
Moez AliClustering Analysis in Power BI using PyCaret 3.0Uncover Actionable Insights with PyCaret 3.0: How to Build a Clustering Model in Power BI·5 min read·Mar 28, 2023--3--3
Moez AliinDataDrivenInvestorWhat’s new in PyCaret 3.0?Exploring PyCaret 3.0: The Latest Features and Upgrades·6 min read·Mar 27, 2023--1--1
Moez AliAnnouncing PyCaret 3.0 — An open-source, low-code machine learning library in PythonExploring the Latest Enhancements and Features of PyCaret 3.08 min read·Mar 19, 2023--9--9
Moez AliPlotly Customization Tips You Can’t Miss for Better Data StorytellingUnleash the Full Potential of Plotly with These Simple and Effective Customization Techniques·7 min read·Mar 10, 2023----
Moez AliUnleashing the Power of Scikit-Learn: 5 hidden gems that you should useA Deep Dive into Powerful Scikit-Learn Functions for Machine Learning·7 min read·Mar 9, 2023----